A Deep Dive into HBPIP
How do you measure a pitcher’s impact on the game of baseball? There’s a million different stats, basic and advanced, that attempt to capture the complexities of pitching. But one of the most nuanced yet primal facets of the game remains relatively simple to calculate: the bean ball.

How do you measure a pitcher’s impact on the game of baseball? There’s a million different stats, basic and advanced, that attempt to capture the complexities of pitching. But one of the most nuanced yet primal facets of the game remains relatively simple to calculate: the bean ball.
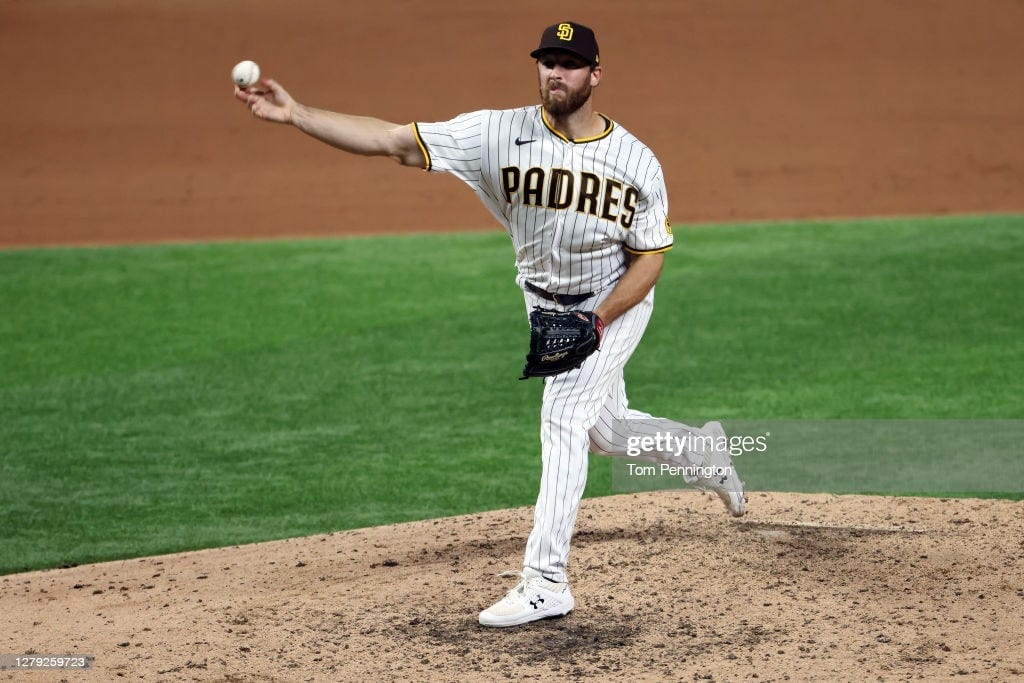
In my latest main column, I mentioned Austin Adams, a pitcher with a World Series ring thanks to the single inning he threw for the Nationals in 2019. In that one inning, he hit one batter. Dive in with me.
Austin Adams went on from Washington to become one of the more dangerous pitchers in the league, a maestro of the chin music, if you will. In 2021, he led the Show in Hit Batters (HB) with 24. But he only pitched 52.2 innings (IP) that year. But does 24 bounces sound that crazy?
Oh yes it does. Let’s compare him to the second-most dangerous pitcher that season. Joe Musgrove hit 18 batters… in 181.1 innings.
This leads us to my new favorite stat: Hit Batters Per Innings Pitched, or HBPIP (pronounced: Huh bip pip).
Compare those two in 2021 by HBPIP
Joe Musgrove: .099
Austin Adams: .459
That’s a whopper of a jump from second to first. Musgrove and Adams also both pitched for the Padres that year. Maybe there was something in that San Diego sunshine.
But there’s more to this story. Bear with me. Here’s the top 20 All-time Batter-hitting Kings, ranked by number of balls beaned1:
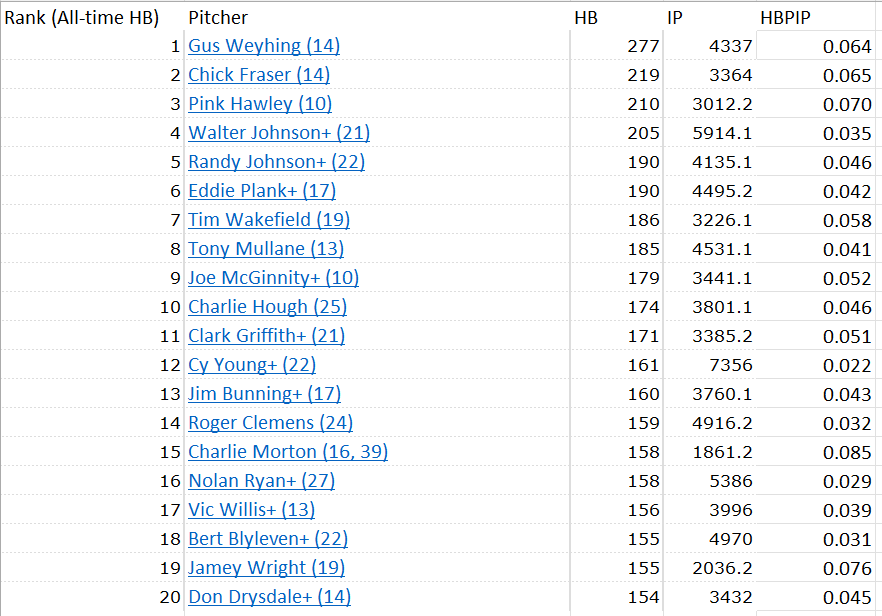
On the right hand side, I’ve included their HBPIPs. None of their HBPIPs get even close to Adams! But those numbers came over lengthy careers. Those guys have thousands of games for that average to drop. So instead, let’s go look at the top 50 seasons of all time.
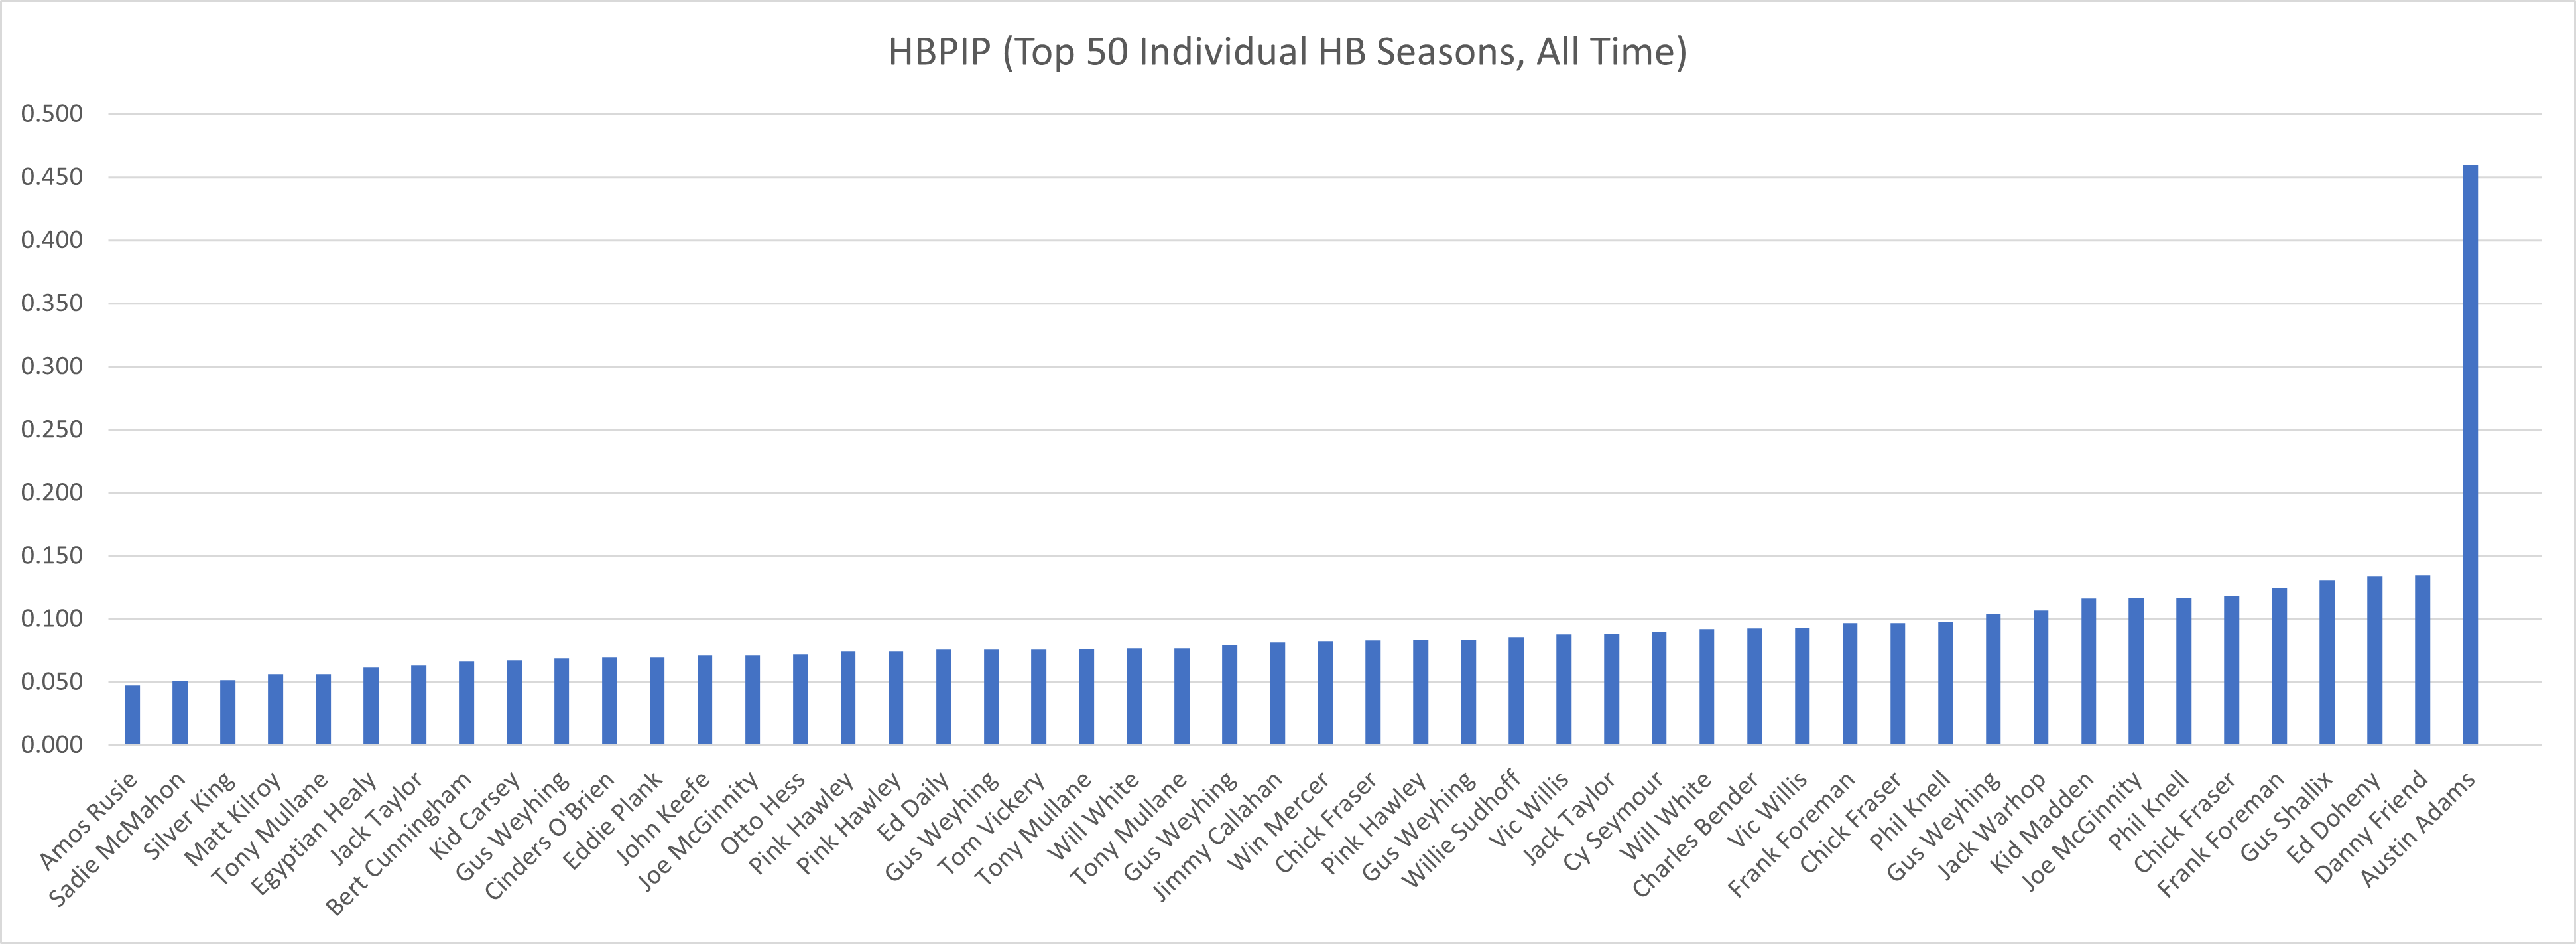
The 50 seasons with the most hit batters in the history of baseball, ranked by HBPIP. Nobody comes anywhere NEAR Adams’ .459. Here’s another wild dimension to this data:
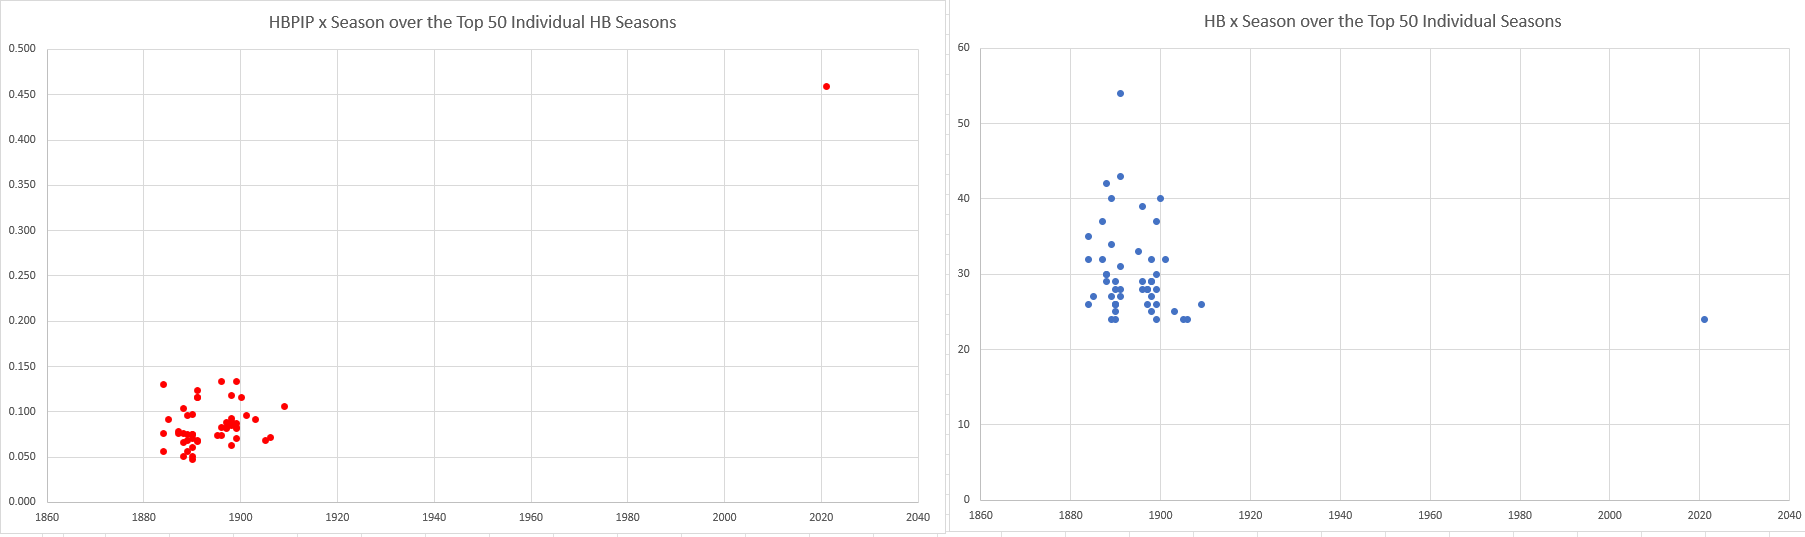
Who’s that outlier? Why yes, it’s Austin Adams in 2021! We can see the golden era for deadly pitchers ran from 1880 to 1910 then came to a screeching halt before A2 brought the Rawlings lobotomy back into style.
The closest player to Adams in the last FIFTY seasons is Nick Lodolo, who threw went for .184 HBPIP in 2022. Still not even close. Austin Adams has managed to stencil his name into the history books with the most bean-ball dense season in history by a truly gobsmacking margin.
Getting hit by pitches is part of the deal. It happens from time to time, and sometimes it happens on purpose. Typically, the odds are miniscule. But if you went to the plate against Adams in 2021, it was practically a coin-toss.
Thanks for taking this dive with me!